Download VIX Futures Data from CBOE
- In my capstone project, I needed a comprehensive file containig the VIX Futures data
- This data is available but not in a user friendly format
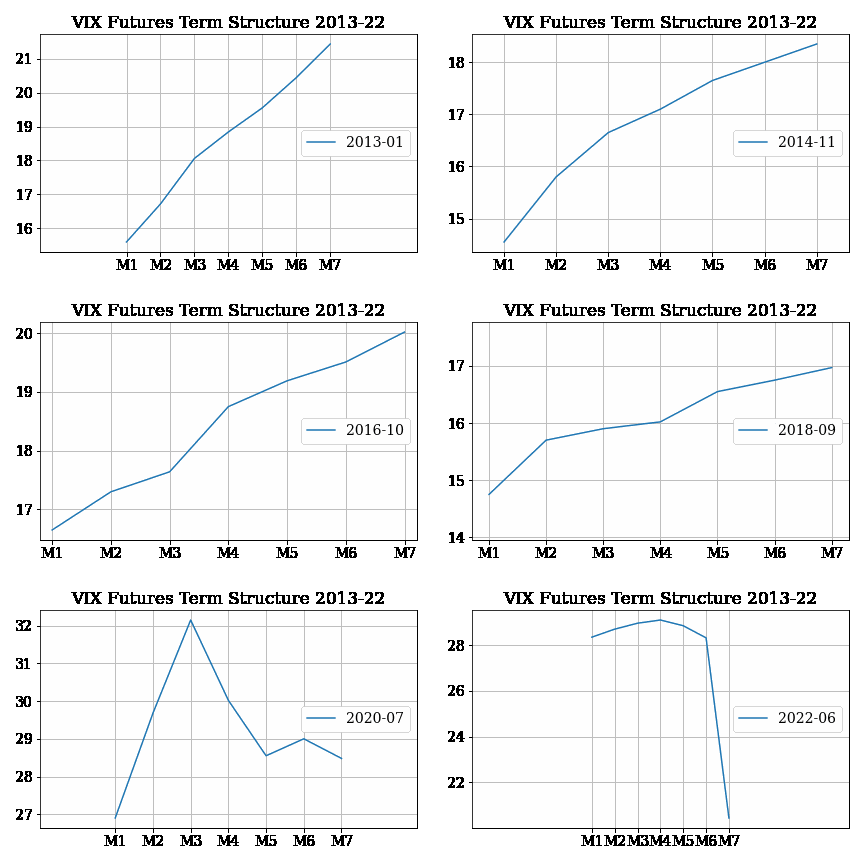
- All experienced Quants I asked for help did not assist, so I decided to download the data myself and produce a nice graphic of the data
Import necessary packages
import pandas as pd
from datetime import datetime
- We will create a data pipeline directly to the CBOE data
- We need the url and the associated file names which happen to be the Expiration dates
- I have a file containing all the expiration dates from 2013 to mid-2022
url = 'https://markets.cboe.com/us/futures/market_statistics/historical_data/products/csv/VX/'
fp = open('Expirations_16_22.txt', 'r',newline='')
contents = fp.readlines()
The download:
- The data is downloaded, file-by-file and appended to one pandas DataFrame as follows:
data = pd.DataFrame()
colz = [] #Not really important since we shall rename the columns later

for entry in contents:
    exp = datetime.strptime(entry.rstrip(), '%d %B %Y').date().strftime('%Y-%m-%d')
    temp = pd.read_csv(url + exp) #Download the csv file directly into/via pandas
    temp['Trade Date'] = pd.to_datetime(temp['Trade Date'])
    temp = temp.set_index('Trade Date')
    if data.empty:
        data = temp['Close']
        colz.append(temp['Futures'][0][0])
    else:
        data = pd.concat([data, temp['Close']], axis=1)
        colz.append(temp['Futures'][0][0])
Data Cleaning:
- Unfortunately, our data has many ‘NaN’ values
- We proceed to copy each line, remove the NaN values and shift the row to the left
- Though we loose the column labels we are happy with the result
df_out = data.apply(lambda x: pd.Series(x.dropna().to_numpy()), axis=1)
df_out = df_out[[0,1,2,3,4,5,6]]
df_out.info()
<class 'pandas.core.frame.DataFrame'>
DatetimeIndex: 2389 entries, 2013-01-02 to 2022-06-24
Data columns (total 7 columns):
 #   Column  Non-Null Count  Dtype
---  ------  --------------  -----
 0   0       2389 non-null   float64
 1   1       2389 non-null   float64
 2   2       2389 non-null   float64
 3   3       2389 non-null   float64
 4   4       2389 non-null   float64
 5   5       2389 non-null   float64
 6   6       2383 non-null   float64
dtypes: float64(7)
memory usage: 149.3 KB
- The remaining NaN vaues are much less and shall be replaced by the row mean
df_out.fillna(df_out.mean(),inplace=True)
df_out.info()
<class 'pandas.core.frame.DataFrame'>
DatetimeIndex: 2389 entries, 2013-01-02 to 2022-06-24
Data columns (total 7 columns):
 #   Column  Non-Null Count  Dtype
---  ------  --------------  -----
 0   0       2389 non-null   float64
 1   1       2389 non-null   float64
 2   2       2389 non-null   float64
 3   3       2389 non-null   float64
 4   4       2389 non-null   float64
 5   5       2389 non-null   float64
 6   6       2389 non-null   float64
dtypes: float64(7)
memory usage: 149.3 KB
- We close the file object and make the trade dates a column instead of an index.
- Our intention is to use this column for the legend in the GIF
fp.close()
df_out = df_out.reset_index()
- We can now access the data row-by-row and plot them
- Let us save our dataframe in an excel file for later use.
# Save the data for future use

df_out.to_excel(r'C:\export_dataframe.xlsx',
               index = True, header=True)
'''

* This is optional code
* Start from here in future. There is no need to rerun most of the preceeding code.

df_out = pd.read_excel('export_dataframe.xlsx')
df_out.head()
'''
"\n\n* This is optional code\n* Start from here in future. There is no need to rerun most of the preceeding code.\n\ndf_out = pd.read_excel('export_dataframe.xlsx') \ndf_out.head()\n"
# Making sure that the 'Trade Date' column isin Date-Time format
df_out['Trade Date'] = pd.to_datetime(df_out['Trade Date'])

# New DataFrame with less columns for easier plotting
df_out1 = df_out[[0,1,2,3,4,5,6]]
#Create an object containing all the trade dates in the correct order

datez = df_out[['Trade Date']]
datez.head()
| Trade Date | |
|---|---|
| 0 | 2013-01-02 |
| 1 | 2013-01-03 |
| 2 | 2013-01-04 |
| 3 | 2013-01-07 |
| 4 | 2013-01-08 |
#We want the legend to show the year and month only so we will transform all dates to that format

datez = datez['Trade Date'].apply("{:%Y-%m}".format).rename('Date')
datez.head()
0    2013-01
1    2013-01
2    2013-01
3    2013-01
4    2013-01
Name: Date, dtype: object
Data Animation
- Lets import the extra packages required for this part of the work
from matplotlib import pyplot as plt
import matplotlib as mpl
import numpy as np
from matplotlib.animation import FuncAnimation
mpl.rcParams['font.family'] = 'serif'
plt.rcParams['font.size'] = '14'
plt.rcParams["figure.autolayout"] = True
#Number of trading days for which we shall plot the term-structure
total_days = df_out1.shape[0]

fig, ax = plt.subplots()

def animate(i):
    '''
    For each i, this function plots the ith Term-structure
    '''
    fig.clear()
    ax = fig.add_subplot(111, aspect='equal', autoscale_on=False,
                         xlim=(0, 7), ylim=(0, 30))
    ax.set_xlim(0, 7)
    ax.set_ylim(0, 30)
    x = np.array(['M1', 'M2', 'M3', 'M4', 'M5', 'M6', 'M7'])
    s = ax.plot(x, np.array(df_out1.loc[i]), label= datez.loc[i])
    ax.legend()
    ax.axis('equal')
    ax.set_title('VIX Futures Term Structure 2013-22')
    leg = ax.legend(loc='center right');
    ax.grid(True)

# FuncAnimation calls the animated function a total number of 'total_days'
# It then plots each plot on fig and ani.save saves the GIF
ani = FuncAnimation(fig, animate, interval=100, frames=range(total_days))

ani.save('animation.gif', writer='pillow')

Conclusion
- The primary objective of downloading the VIX Futures Term-structure data as one complete file has been attained.
- The secondary objective of obtaining an animation of the Term-structure has been partially achieved. The GIF behaves in an erratic manner for some trading days.
- Overall, the results are informative enough
- Later on, I would like to incorporate a measure of the Contango and the Backwardation of the Term-structure
References
- https://stackoverflow.com/questions/62643493/remove-nan-values-and-shift-values-from-the-next-column
- https://stackoverflow.com/questions/18689823/pandas-dataframe-replace-nan-values-with-average-of-columns
- https://www.tutorialspoint.com/saving-scatterplot-animations-with-matplotlib