Data Analysis: Loan data
- Loading the libraries
- Number of Loans per State
- Analysing Existing Debt
- Creating Functions:
- Conclusion
In the fourth quarter of 2020 I tried to enrole for a diploma/fellowship at Correlation One. Need less to say, I did not make it. However, I was challenged by one of their enrollement/assesment requirements.
The question that I was required to answer was the following…
How many loans were given for the Carlifornia State?
I kept the .csv data and managed to revisit it. Lets dive in:
Loading the libraries
We will need Pandas, Matplotlib as well as some inbuilt Python functionality.
import pandas as pd
import matplotlib.pyplot as plt

data=pd.read_csv('DS4A_data.csv')
data.head()
| RECORD_CREATION_DATE | LOAN_AMOUNT | CREDIT_RANGE | EXISTING_DEBT | AGENT_NOTES | OFFICE_LOCATION | DEFAULTED | |
|---|---|---|---|---|---|---|---|
| 0 | 01May2014:09:24:27.000000 | 2500 | 760-779 | $10,001-$20,000 | NaN | NORTHERN CALIFORNIA | False |
| 1 | 01May2014:09:48:36.000000 | 2500 | 700-719 | $1-$10,000 | Annual gross income: $25,400 | SOUTHERN CALIFORNIA | False |
| 2 | 01May2014:10:10:36.000000 | 6300 | 740-759 | $100,000+ | NaN | ARIZONA | True |
| 3 | 01May2014:10:31:25.000000 | 4300 | 780-799 | $1-$10,000 | Annual gross income: $191,900 | SOUTHERN CALIFORNIA | False |
| 4 | 01May2014:10:46:54.000000 | 20100 | 780-799 | $90,001-$100,000 | Verified monthly debt payments: $1,700 | SOUTHERN CALIFORNIA | True |
The data has seven columns. My first desire is to see how many states are in this data set.
state_list=[]
for index, row in data.iterrows():
    if row['OFFICE_LOCATION'] not in state_list:
        state_list.append(row['OFFICE_LOCATION'])
state_list
['NORTHERN CALIFORNIA',
 'SOUTHERN CALIFORNIA',
 'ARIZONA',
 'OREGON',
 'WASHINGTON STATE',
 'NEVADA']
Number of Loans per State
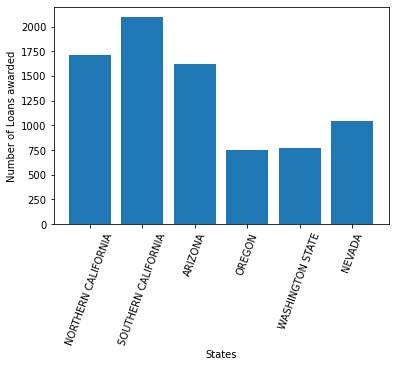
It appears the data has only six states. Now let us find out how many loans were awarded per state. We will use a dictionary to store the results as follows:
loan_num_per_state = {}

for index, row in data.iterrows():
    if row['OFFICE_LOCATION'] in loan_num_per_state:
        loan_num_per_state[row['OFFICE_LOCATION']]+=1
    else:
        loan_num_per_state[row['OFFICE_LOCATION']]=1
loan_num_per_state
{'NORTHERN CALIFORNIA': 1715,
 'SOUTHERN CALIFORNIA': 2096,
 'ARIZONA': 1621,
 'OREGON': 755,
 'WASHINGTON STATE': 774,
 'NEVADA': 1039}
Plotting the Results:
While the dictionary above is clear, we would like to plot a bar graph of the data. This will make the information easier to interpret. One problem that arose was that the state names were overlapping and not readable. The rotation option enables us to slant the column names to our desired angle. Beautiful….
plt.plot()
plt.bar(range(len(loan_num_per_state)), list(loan_num_per_state.values()), align='center')
plt.xticks(range(len(loan_num_per_state)), list(loan_num_per_state.keys()), rotation=70)
plt.xlabel('States')
plt.ylabel('Number of Loans awarded')
plt.show()

Analysing Existing Debt
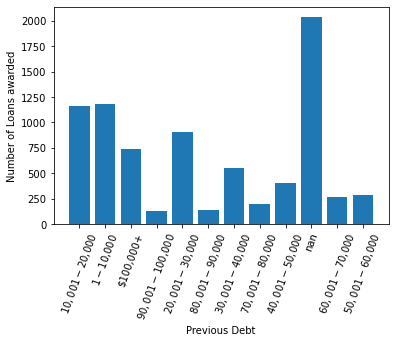
In the Pandas dataframe I noticed that there was a column for existing debt. Using a similar approach as above, I obtained a dictionary for the various debt categories. As expected, the majority of the loans awarded were to people who had a low existing debt or non at all. Here we assumed that nan meant they had none.
loan_existing_debt = {}

for index, row in data.iterrows():
    if row['EXISTING_DEBT'] in loan_existing_debt:
        loan_existing_debt[row['EXISTING_DEBT']]+=1
    else:
        loan_existing_debt[row['EXISTING_DEBT']]=1
plt.plot()
plt.bar(range(len(loan_existing_debt)), list(loan_existing_debt.values()), align='center')
plt.xticks(range(len(loan_existing_debt)), list(loan_existing_debt.keys()), rotation=70)
plt.xlabel('Previous Debt')
plt.ylabel('Number of Loans awarded')
plt.show()

Creating Functions:
It would be interesting to get the relationship between number of loans awared, total loan value and the loan averge by state. However, it would be better to create a function to capture all the operations for repeatability.
def loan_data_by_state(info, state):
    state_stats = {'Num_Loans': 0, 'Total_Loans': 0, 'Average_loan': 0}
    for index, row in info.iterrows():
        if row['OFFICE_LOCATION'] == state:
            state_stats['Num_Loans']+=1
            state_stats['Total_Loans']+=row['LOAN_AMOUNT']
    state_stats['Average_loan'] = state_stats['Total_Loans']/state_stats['Num_Loans']
    return state_stats
def loan_vs_default_by_state(info, state):
    state_stats = {'Num_Loans': 0, 'Num_Defaulted': 0}
    for index, row in info.iterrows():
        if row['OFFICE_LOCATION'] == state:
            state_stats['Num_Loans']+=1
            if row['DEFAULTED']=='False':
                state_stats['Num_Defaulted']+=1
    return state_stats
loan_data_per_state={}
for state_ in state_list:
    loan_data_per_state[state_]=loan_data_by_state(data,state_)
loan_data_per_state
plt.xlabel('States')
plt.ylabel('Number of Loans awarded')
{'NORTHERN CALIFORNIA': {'Num_Loans': 1715,
  'Total_Loans': 11324600,
  'Average_loan': 6603.265306122449},
 'SOUTHERN CALIFORNIA': {'Num_Loans': 2096,
  'Total_Loans': 13573600,
  'Average_loan': 6475.954198473282},
 'ARIZONA': {'Num_Loans': 1621,
  'Total_Loans': 10612900,
  'Average_loan': 6547.131400370142},
 'OREGON': {'Num_Loans': 755,
  'Total_Loans': 4713900,
  'Average_loan': 6243.576158940397},
 'WASHINGTON STATE': {'Num_Loans': 774,
  'Total_Loans': 5034600,
  'Average_loan': 6504.6511627906975},
 'NEVADA': {'Num_Loans': 1039,
  'Total_Loans': 6758500,
  'Average_loan': 6504.812319538018}}
loan_default_per_state={}
for state_ in state_list:
    loan_default_per_state[state_]=loan_vs_default_by_state(data,state_)
loan_default_per_state
{'NORTHERN CALIFORNIA': {'Num_Loans': 1715, 'Num_Defaulted': 0},
 'SOUTHERN CALIFORNIA': {'Num_Loans': 2096, 'Num_Defaulted': 0},
 'ARIZONA': {'Num_Loans': 1621, 'Num_Defaulted': 0},
 'OREGON': {'Num_Loans': 755, 'Num_Defaulted': 0},
 'WASHINGTON STATE': {'Num_Loans': 774, 'Num_Defaulted': 0},
 'NEVADA': {'Num_Loans': 1039, 'Num_Defaulted': 0}}
Conclusion
I still have a lot to learn, and would appreciate another chance at the DS4A Fellowship. However, it is not offered to people outside the United States.
Still, I am grateful.